• Home
  • Frey Perímetro AP-250

Frey Perímetro AP-250

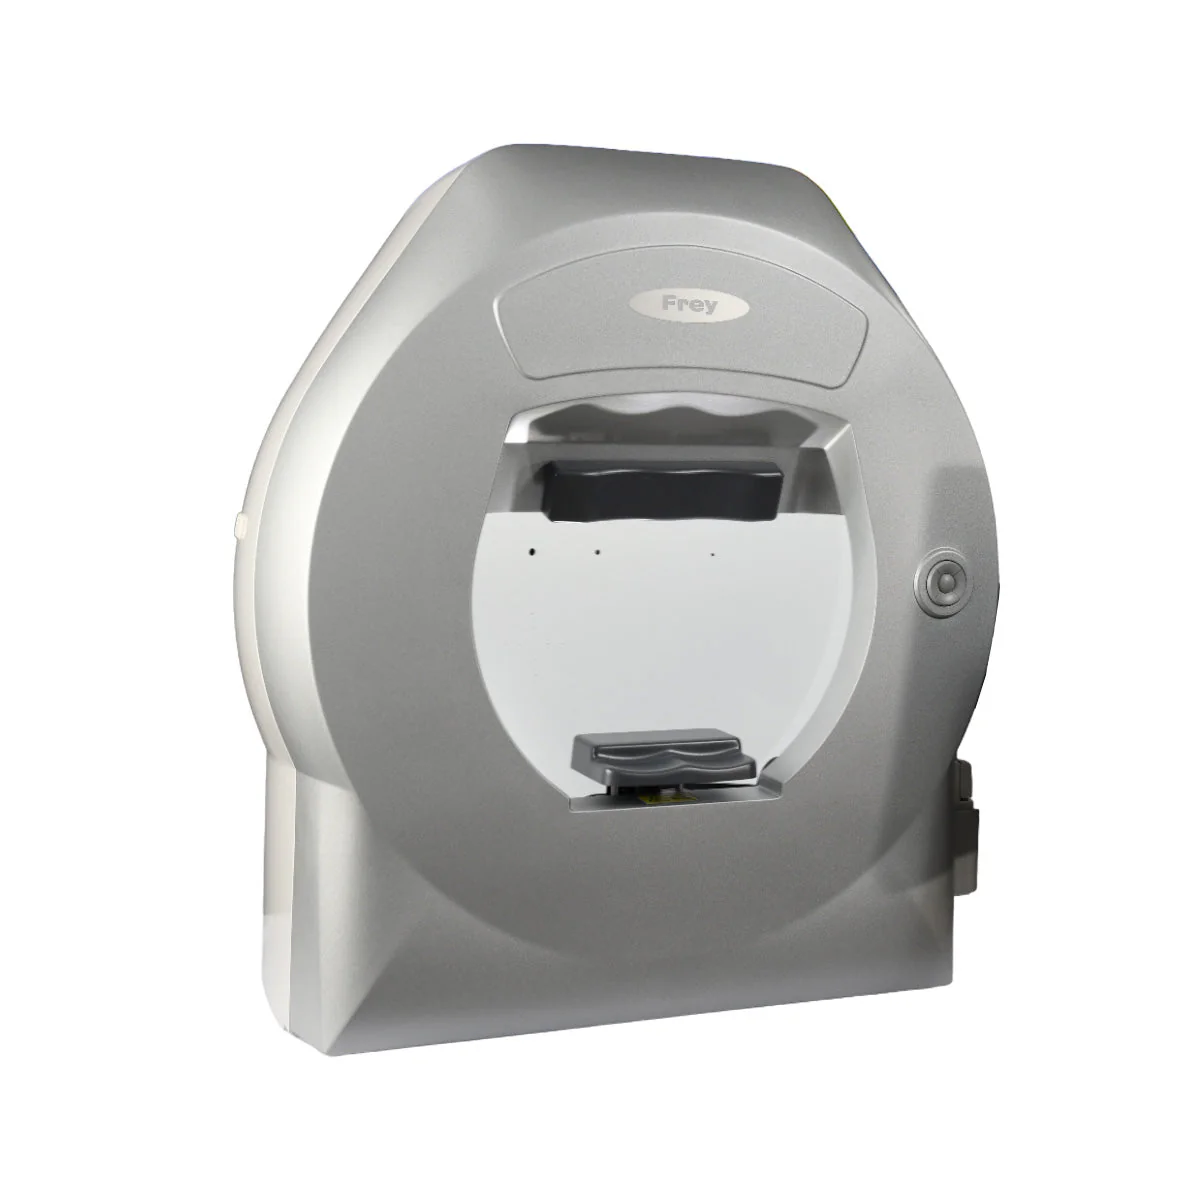
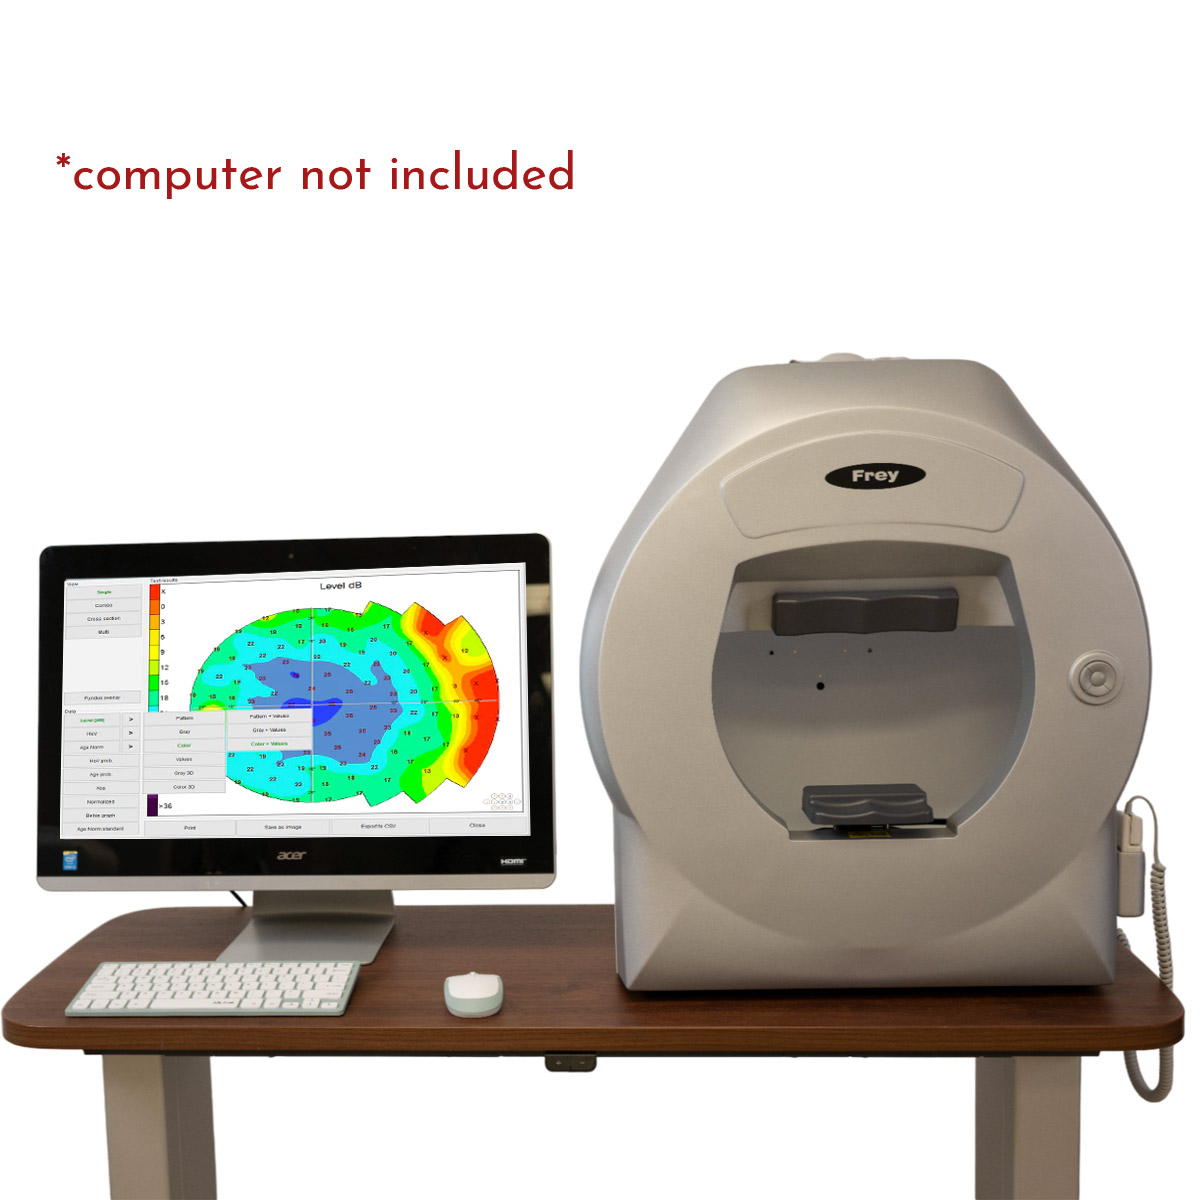
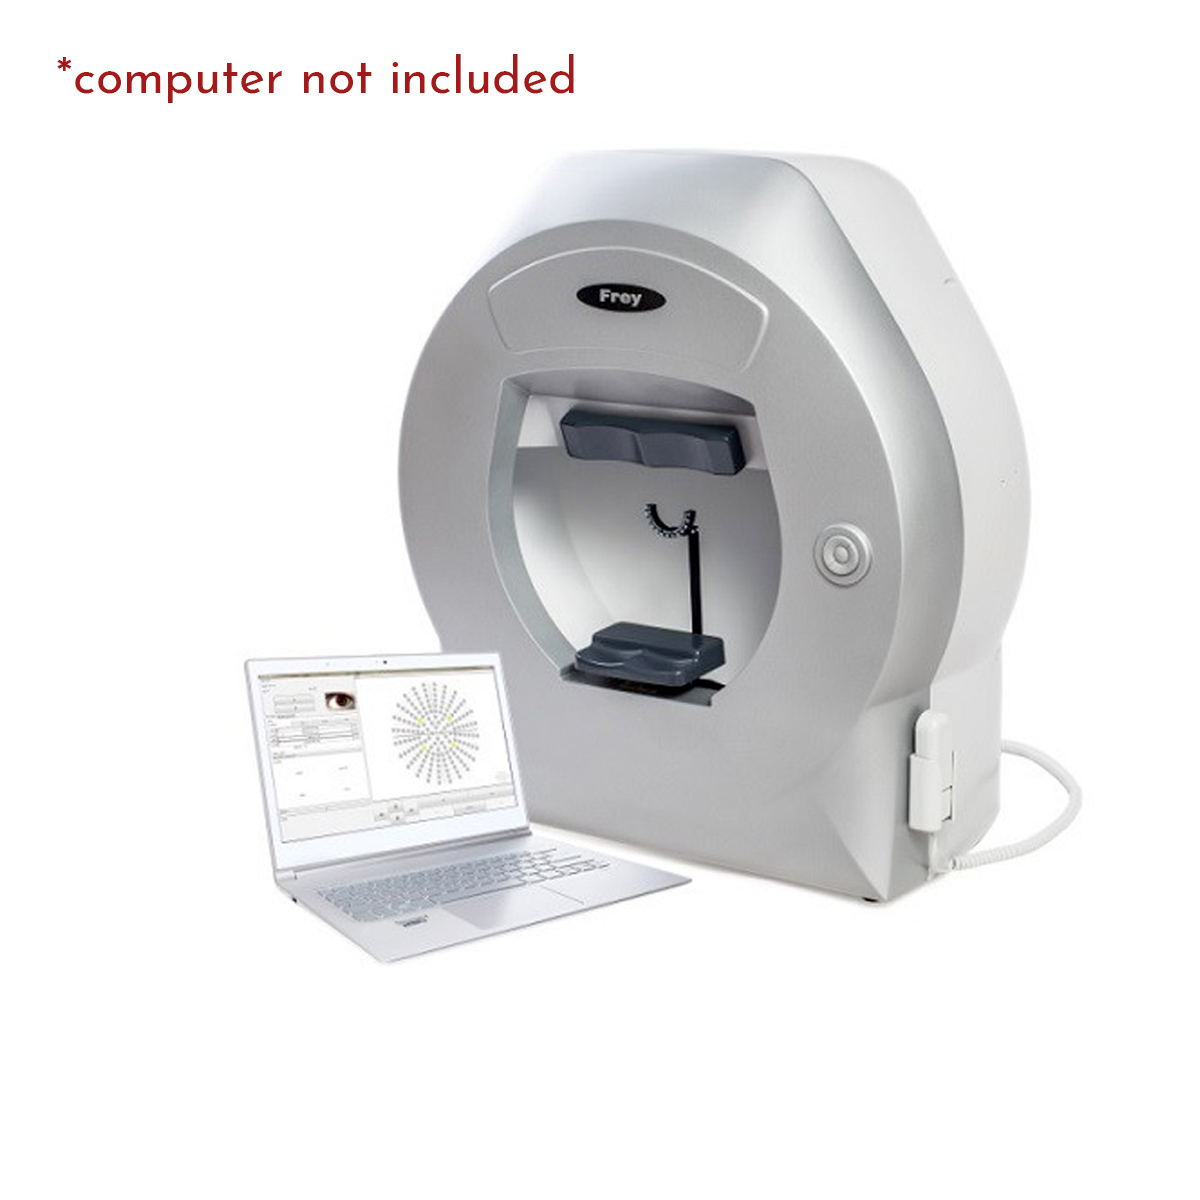
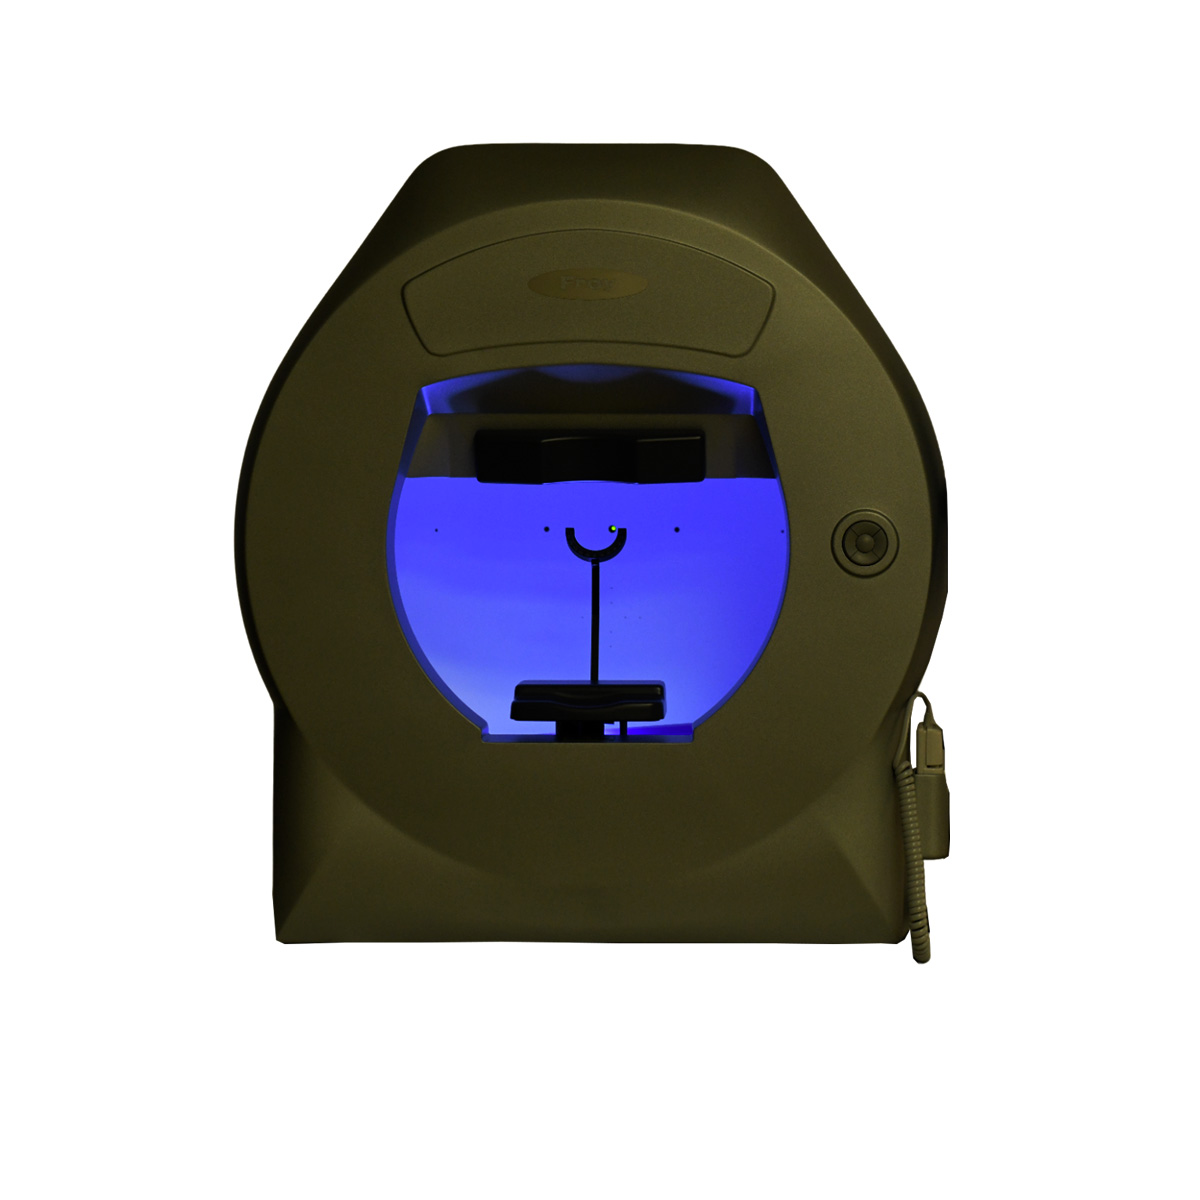
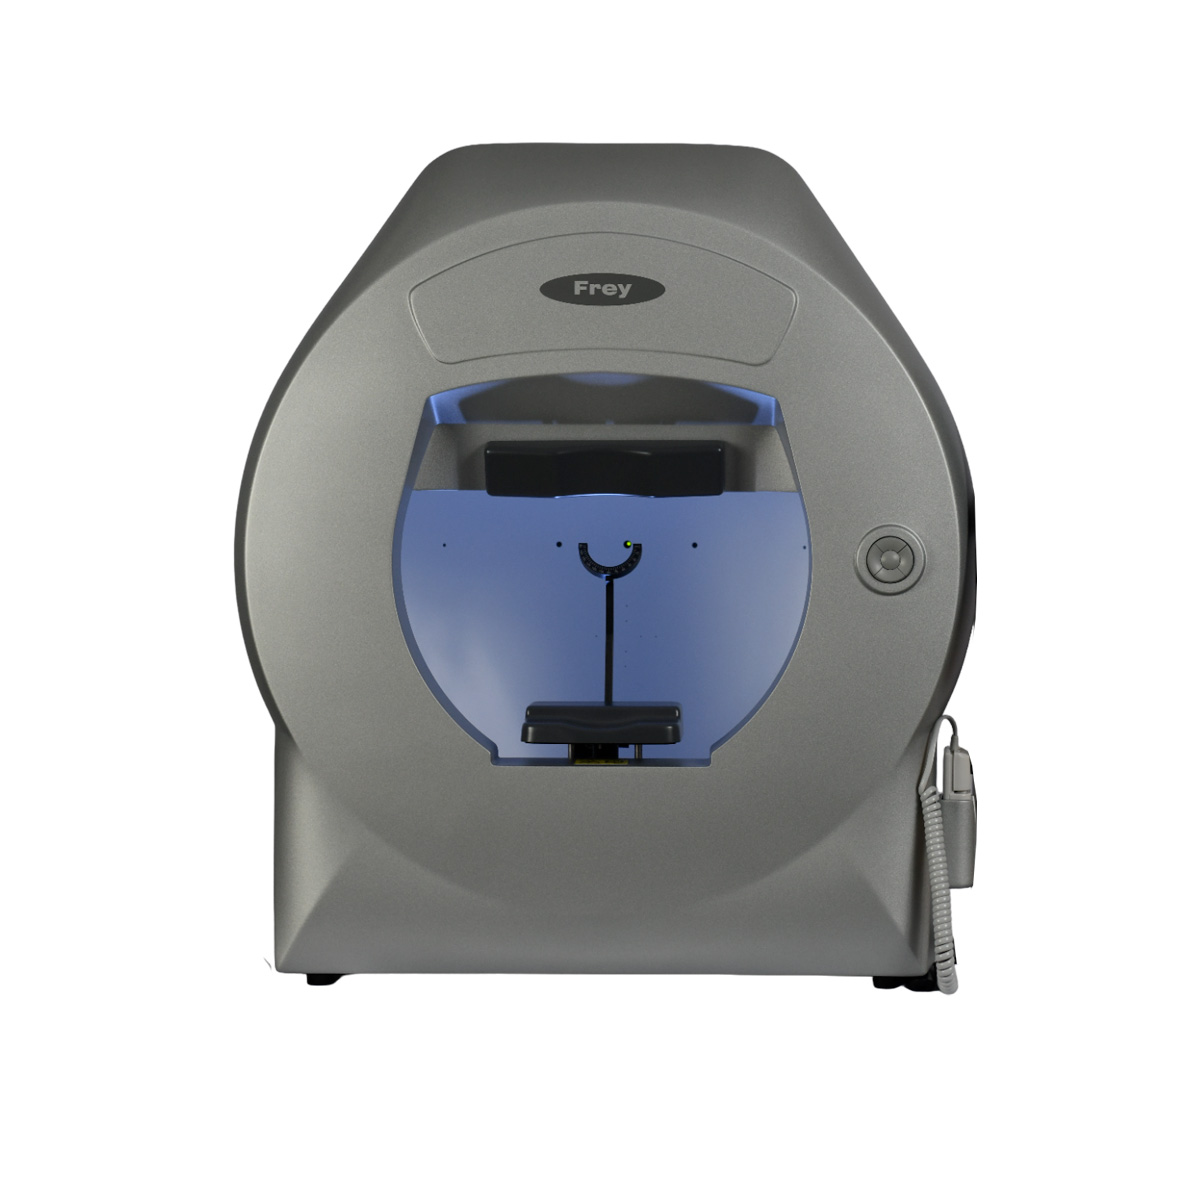
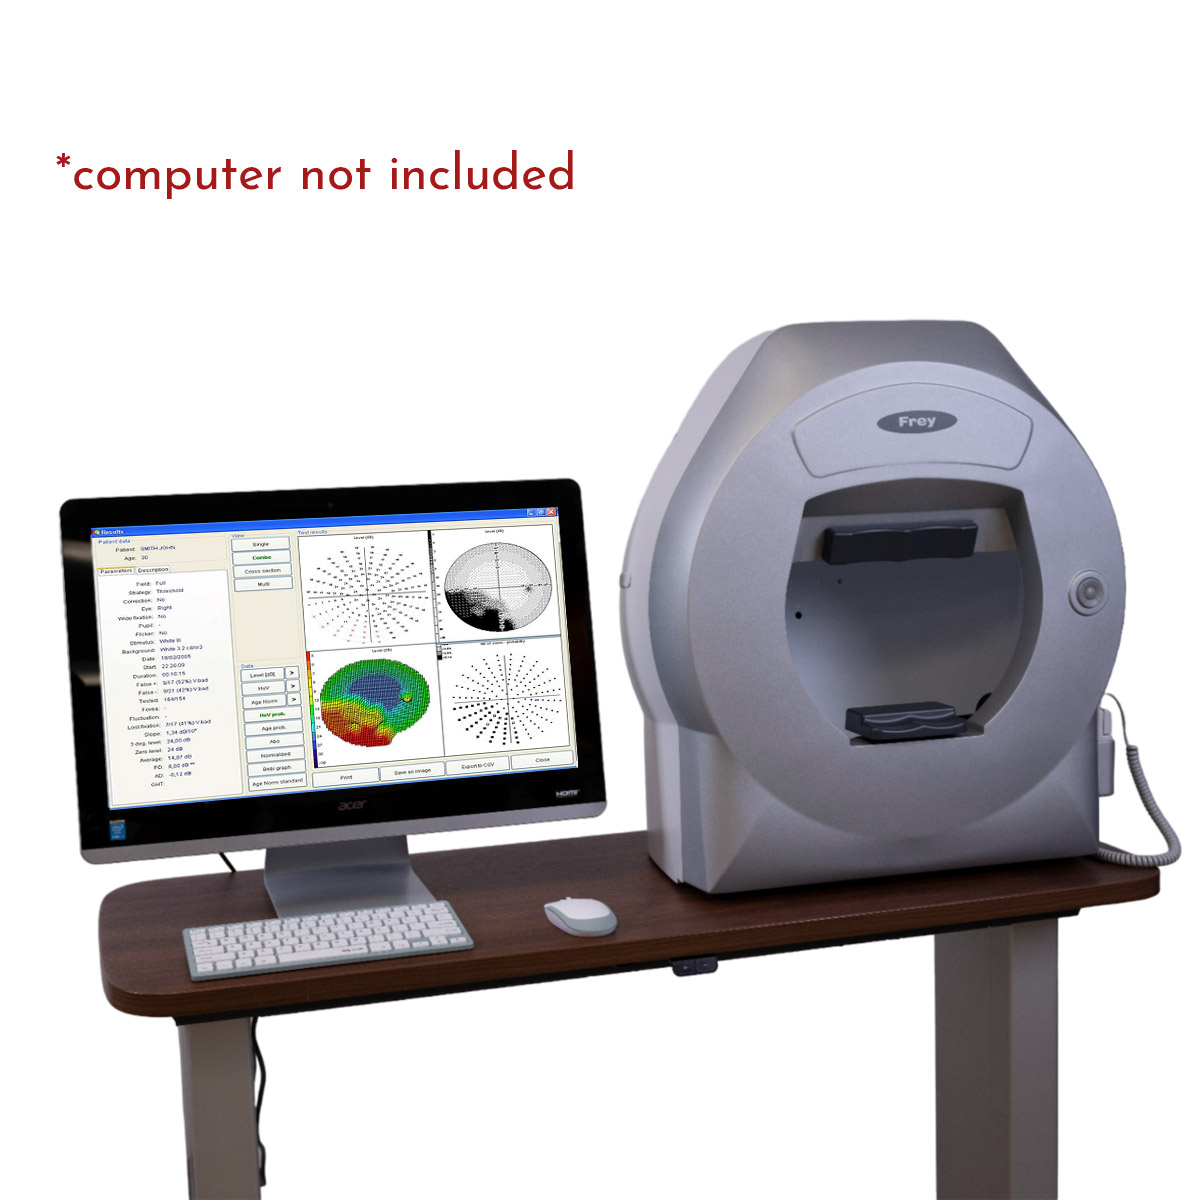
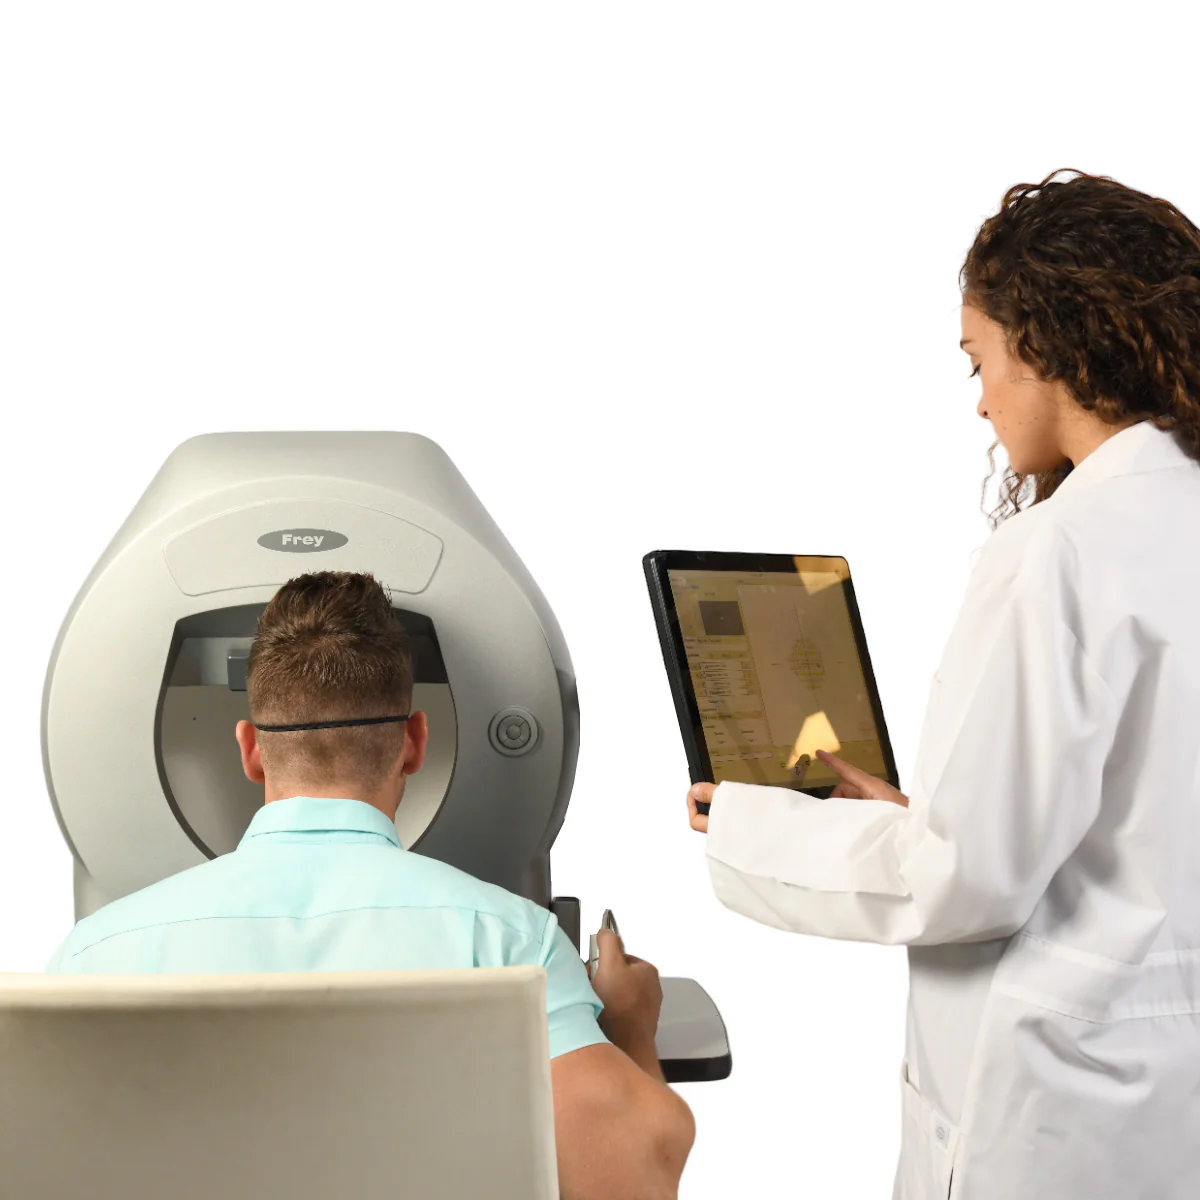
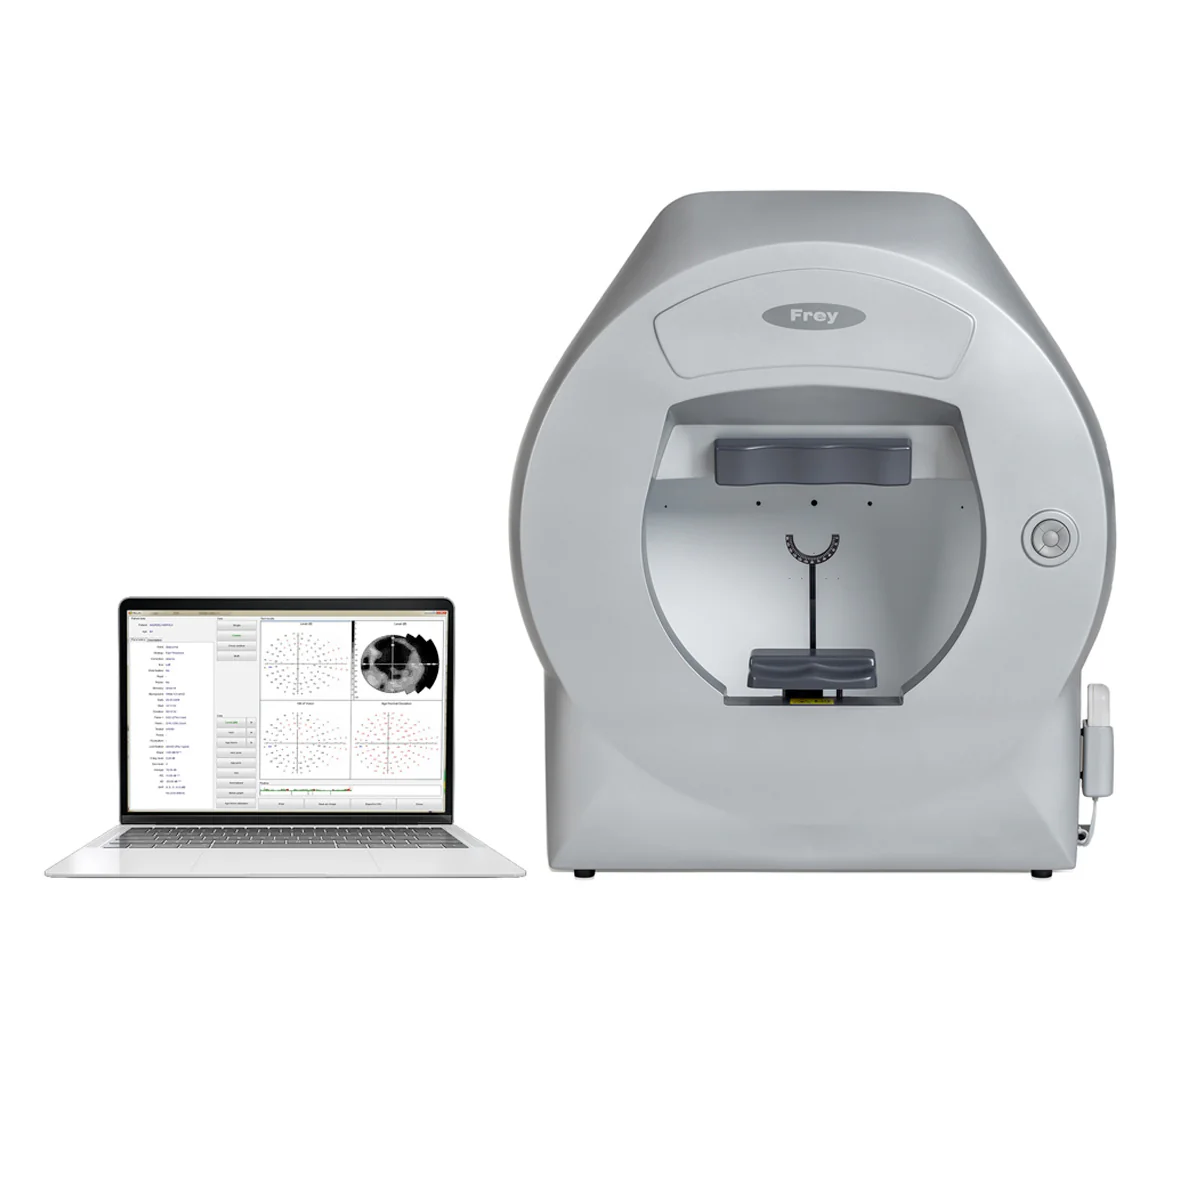
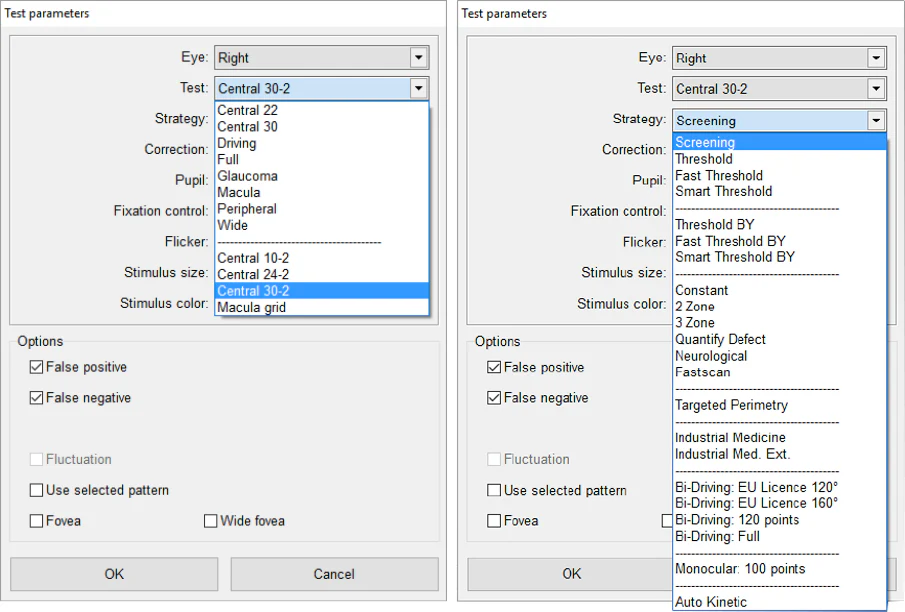
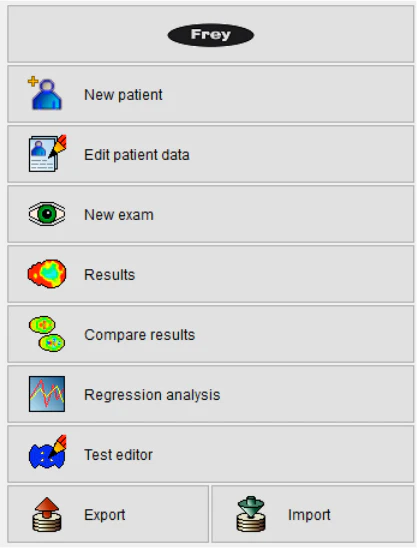
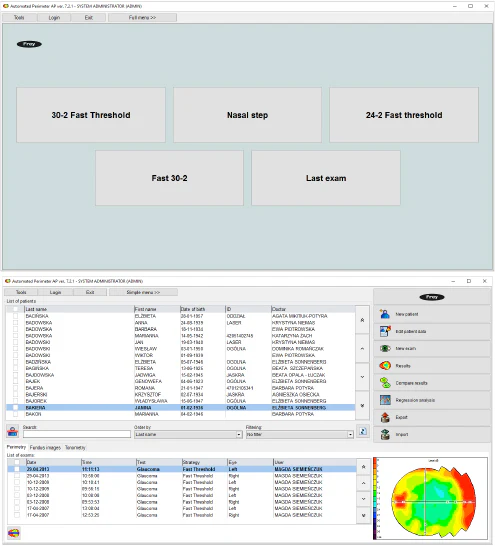
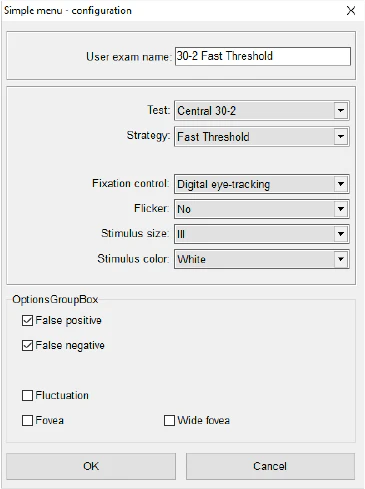
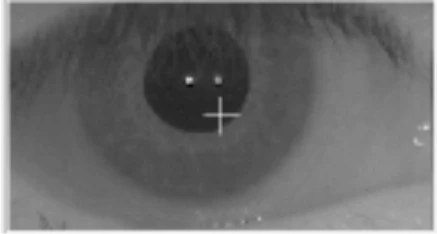
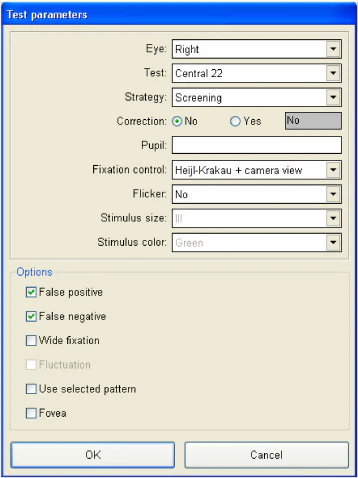
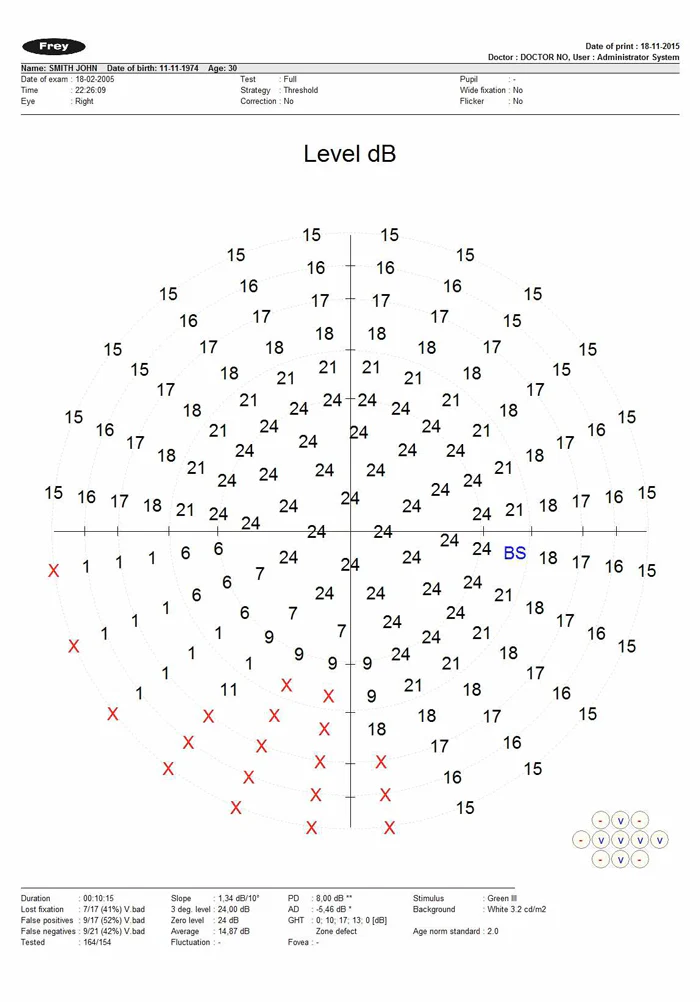
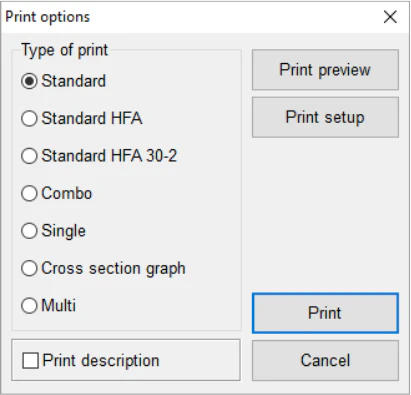
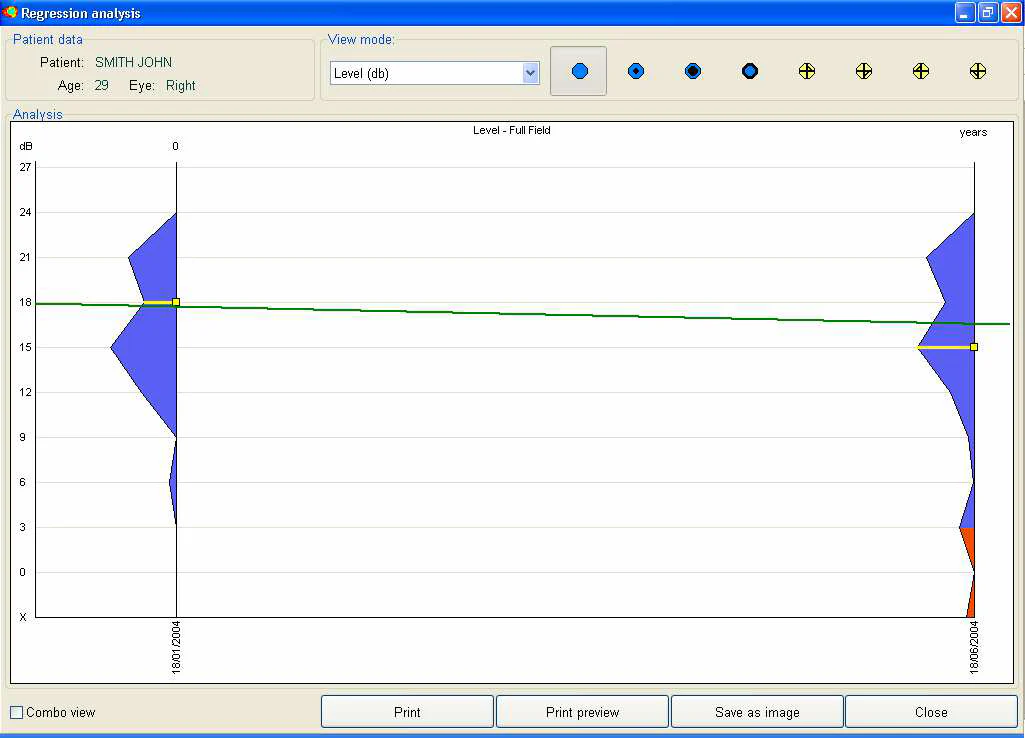
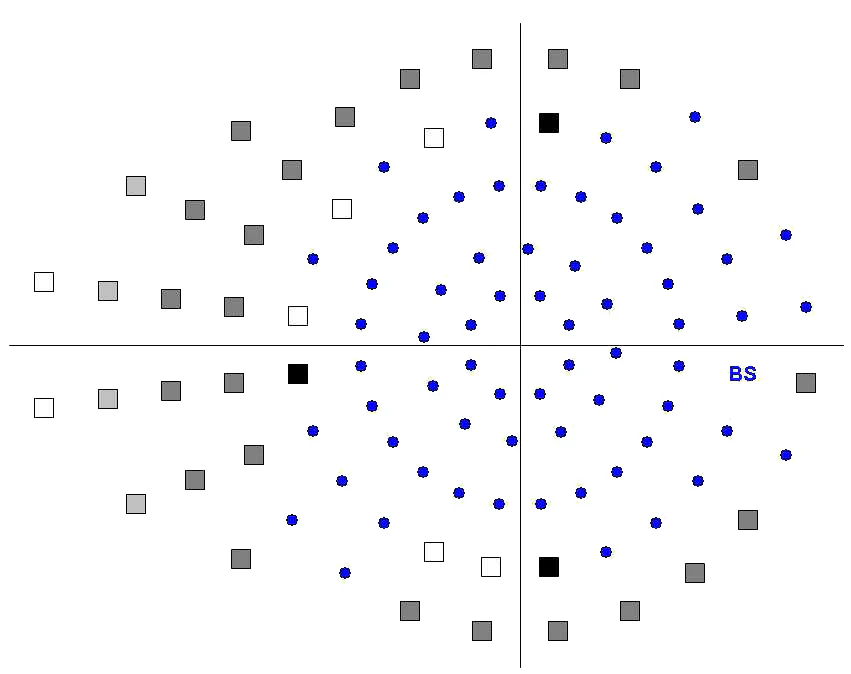
O analisador de campo visual AP-250 é um perímetro automatizado de projeção LED estática totalmente funcional, com medição de campo completo. O AP-250 utiliza projeção de estímulos em LED verde no tamanho III de Goldman. O software fornecido com o dispositivo oferece uma ampla variedade de estratégias, campos e parâmetros de teste. O controle de fixação é realizado automaticamente por meio da câmera integrada ou pelo controle da posição do ponto cego. As análises de dados integradas incluem análise de regressão e formatos padronizados para apresentação e impressão dos resultados dos testes. O perímetro Frey AP-250 pode ser facilmente configurado em qualquer computador PC que utilize o sistema operacional Windows.

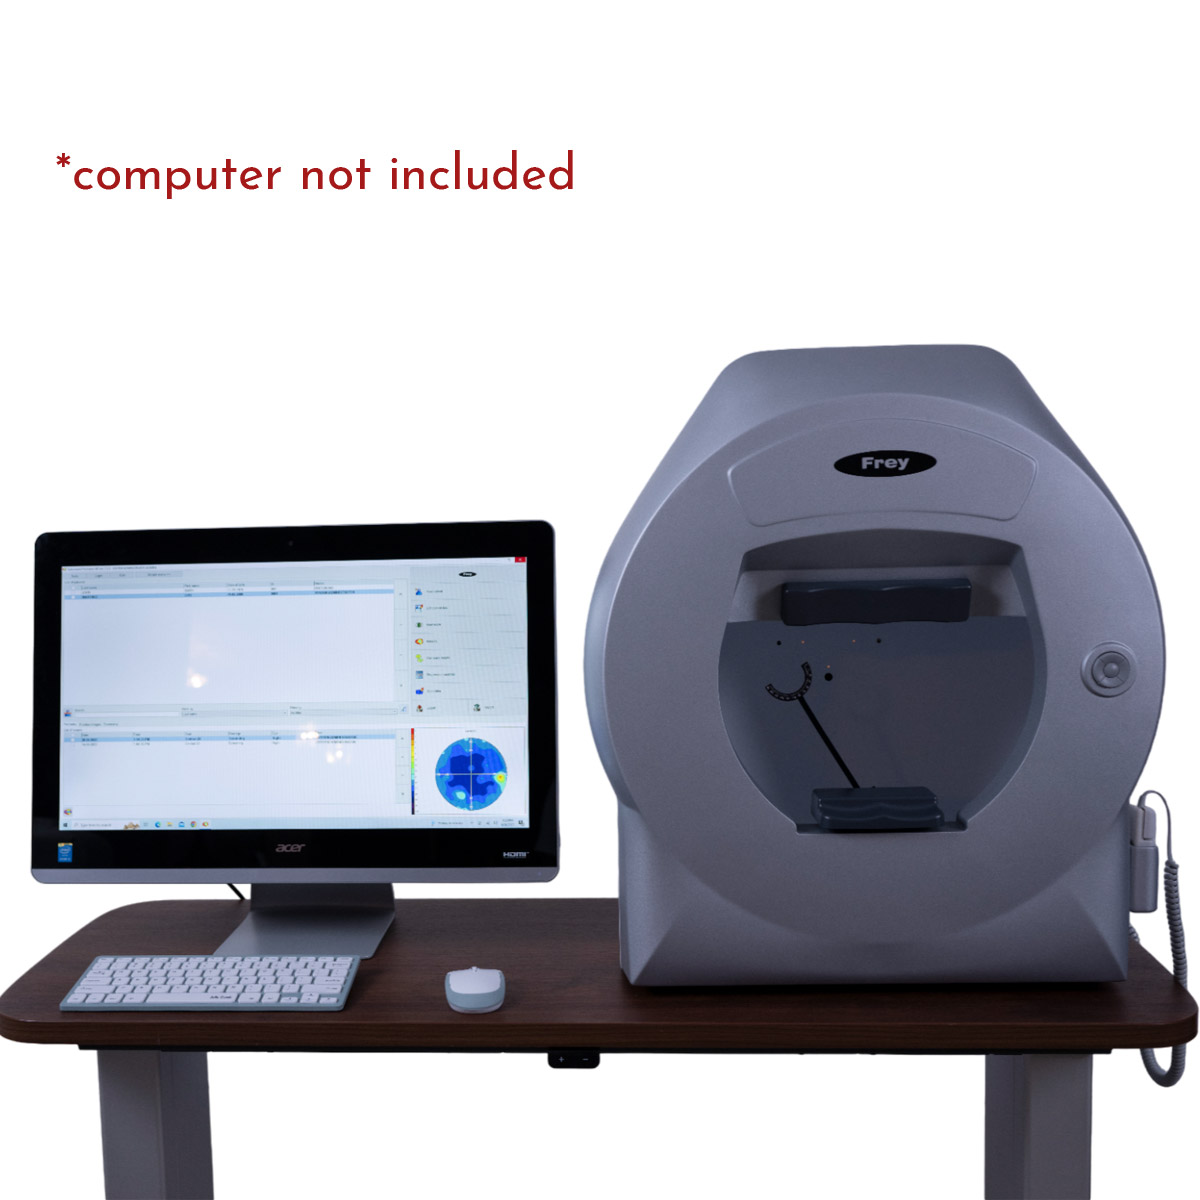
*O monitor não está incluído.

Falar com um especialista

Focus on the patient – ​​greater comfort

Visual field testing is a partnership between clinician and patient. Also known as perimetry, it’s a joint effort. A well-informed and comfortable patient generates greater reliability in the examination. This greater reliability results in more accurate and effective diagnosis and management by the physician. Consequently, it improves patient outcomes and satisfaction throughout their journey, which can last decades. Frey has delivered greater comfort with a chin rest designed for stability. The patient’s head is supported throughout the examination. The AP-250 features improved ventilation, reducing stress and increasing patient comfort.

Accurate Results

The stimulator dome offers a high density of concentric points. Enhanced stimulus control combined with automatic eye tracking provides repeatable and accurate examinations of the patient’s visual field loss.

Quick Test Times

Efficient testing is performed using rapid screening and thresholding strategies, as well as improved fixation methods. Patients with advanced visual loss are assisted with pattern calibration and neurological methods.

Operating Modes:

Static Test Mode

The AP-250 emits fixed stimuli of varying luminance to determine the patient’s threshold. A dim light appears in a specific location, and if the patient does not perceive it, the intensity increases. The patient’s responses are compared with individuals from a control group of the same age.
The examination is defined by Test and Strategy, all stimulus colors and sizes are available, and the results are more reliable and of higher quality.

Static Test Parameters

Two new parameters can be configured:

  • Stimulus Size
  • Stimulus Color

The backlight color is white for all tests except for the blue-on-yellow test. For that test, the stimulus size is Goldman III.
Selecting the appropriate testing strategy is important, and with the AP-250 , we test nearly twice as many points compared to competitors in the same visual field. Furthermore, the AP-250 provides fast scanning and intelligent thresholding, further enhancing examination accuracy.

Results Screen

The “Results” screen is divided into functional boxes. Detailed descriptions are provided in the following section (Single, Combined, Cross-section, and Multi).

Cross-sectional view

It is a graphic map that divides the visual field into two parts represented by the colors red and blue. The study facilitates the selection of the cutoff angle and allows measuring sensitivity in decibels in all directions of the visual field up to 60˚.

Intuitive Software

The AP-250 design is focused on both the patient and the clinician. The Frey perimeter software is intuitive and easy to use, allowing for efficient and effective operation by various qualified professionals. Interactive menus provide comprehensive information and efficient operation, reducing the time spent preparing, reviewing, and printing exams. This platform supports clinical excellence with increased patient flow and effectiveness.

  • Information about the version
  • Add New Patient
  • Edit Patient Data
  • Start New Exam
  • Results Review
  • Comparison Function
  • Regression Analysis
  • Test Editor
  • Export/Import Function

Patient Image Bank

The perimeter application can be used as an image bank, for example, for background images.
DICOM background files can also be imported automatically.

Dual Home Screen Option

This feature allows for two main screen options: a simplified one for use in the examination room by the operator, with customized test selection and standardized procedures, and a full interface for reception areas or medical offices.

Simple Menu Customization

The simple menu is fully customizable, and all test parameters can be configured according to the client’s request. The clinical workflow is also improved, allowing for standardization of the testing procedure. Furthermore, the software is user-friendly, requiring fewer prerequisites.

Fixing Control

The AP-250 Automated Perimeter has two fixation control mechanisms.

Heijl-Krakau Method
: A classic method that verifies the blind spot position by evaluating 11 random points to confirm the correct eye position.

Eye Position Method:
The AP-250 facilitates fixation analysis using a video camera that allows constant monitoring of the pupil. The advantage is that it rejects patient responses when fixation is not present.

Reliability

Automated fixation control with integrated camera and eye tracking increases the repeatability and reliability of data capture.

Automatic Pupil Detection:
If the automatic fixation monitoring method is used, the software detects the current eye position. It is not necessary to keep the eye centered in the image during the test, although it is essential that the patient always looks at the fixation point. The eye positioning control feature can be accessed via the screen, joystick, or software. Additionally, the chin rest can be adjusted up/down and right/left.

Advanced Techniques

Previously, glaucoma was only diagnosed in advanced stages. Currently, new technologies allow for early detection of this condition.

Scintillation (Critical Blink Fusion)
Glaucoma affects sensitivity to intermittent light stimuli.
FFC analyzes the patient’s ability to perceive changes in light and dark stimuli in different areas of the visual field.
It also measures early neuronal damage, detecting glaucoma in its initial stages.

Unique Print

The AP-250 uses the simplest form of printing, which contains a large graphic map representing the exam results. It will be printed in the same format chosen on the “Results” screen in “Single mode”. When single mode is not selected, the dB level map in grayscale is printed by default. The advantage of the “single print” option is the high legibility of the printout.

Multiple Printing Options

Users have the option to choose from 1 of 7 available print patterns. HFA-style prints are predefined, as are standard static perimeter prints (FREY, Medmont, etc.). Prints can be in grayscale or color.

Multiple Results Review Options

The AP-250 is equipped with a powerful set of data presentation modes.

Standard Calibration

The AP-250 was designed to reduce examination time in patients with significant visual field loss.
Previous examinations can be used as a starting point for a new test.
The “Standard” examination defines this starting point, and in addition, blind stimulus sites are tested with maximum intensity.
All test parameters are identical to the reference examination and are selected in the test parameters window when starting the new examination.

Multiple Pattern Testing Options

5 different testing programs
. Visual monitoring of both of the patient’s eyes.

Reliability

Reliable automated fixation control assists both patient and clinician with an integrated camera and automated eye tracking. This increases the repeatability and reliability of data capture.

Regression Analysis – Static Perimetry

The AP software is equipped with options that allow you to observe changes in the patient’s vision in different ways. The first possibility is a simple comparison of results. The second, more advanced, is regression analysis, which helps to observe the progression or regression of vision over time.

At least two examinations are required to perform the regression analysis. The examinations must be performed using the same strategy, but on different days.

The patient’s name, age, and eye tested are listed in the upper left corner of the screen. A selection box in the upper center allows you to choose one of five parameters to calculate and display the regression graph. Available parameters:

  • Level in decibels
  • Decibel level of the Viewing Hill
  • Normal deviation for age (in decibels)
  • Pattern defect (PD)
  • Average defect (AD)

The checkbox is available in “Single mode”. “Combined mode” displays all five regression graphs together.

Probability Map of the Viewing Hill

A “hill of vision probability map” shows the probability of defects at each point in the visual field. The probabilities are calculated from the differences between theoretical and measured hills of vision. The lower the probability, the greater the defect in the visual field.

Full Analysis Modes

The reliability and functionality of the AP-250 are enhanced by comprehensive analysis modes, backed by world population statistics.
The shaded maps have an improved 3D function.

Normal Map by Age

An age-specific normal range map shows the differences between normal values ​​for the age and the values ​​obtained in the test. Thus, it reflects the difference between the theoretical dB range and the measured value.

This map can be displayed in the following formats: numeric, grayscale, color scale, pattern scale, and 3D graph.

Multiple Testing Capabilities

Frey’s automated perimetry technology offers complete flexibility for both clinician and patient. This makes it possible to offer tests for glaucoma, full field, scintillation, simple binocular vision, and driving assessment. This flexible platform provides visual field testing solutions that cover the wide range of clinical characteristics.